Introduction
For the “Practical Machine Learning” course at Coursera, the class was given a dataset from a Human Activity Recognition (HAR) study1 that tries to assess the quality of an activity (defined as “… the adherence of the execution of an activity to its specification …”), namely a weight lifting exercise, using data from sensors attached to the individuals and their equipment.
In contrast to other HAR studies, this one2 does not attempt to distinguish what activity is being done, but rather to assess how well is the activity being performed.
Figure 1: Location of body sensors3
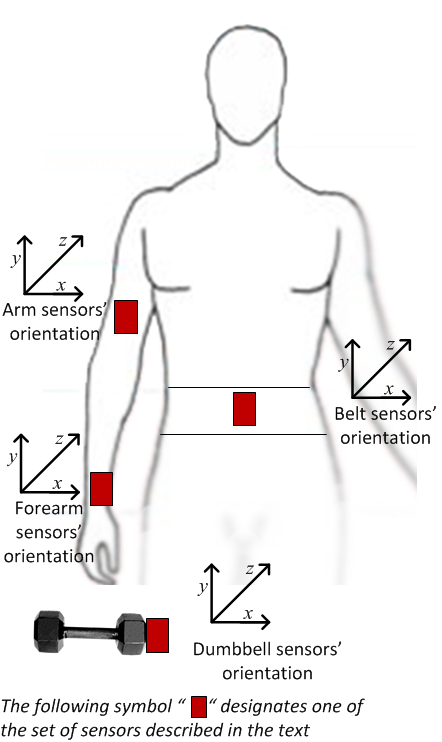
The aforementioned study used sensors that “… provide three-axes acceleration, gyroscope and magnetometer data …”, with a Bluetooth module that allowed experimental data capture. These sensors were attached (see Figure 1), to “… six male participants aged between 20-28 years …” who performed one set of ten repetitions of the Unilateral Dumbbell Biceps Curl with a 1.25kg (light) dumbbell, in five different manners (one correct and four incorrect):
- Exactly according to the specification (Class A)
- Throwing the elbows to the front (Class B)
- Lifting the dumbbell only halfway (Class C)
- Lowering the dumbbell only halfway (Class D)
- Throwing the hips to the front (Class E)
Getting and cleaning the data
There were two datasets in CSV format, one to be used for
training, and another one for testing. The training dataset contained 19622 rows and
160 columns, including the classe variable
which classified the entry according to the how well the exercise was
performed (vide supra). The testing dataset has only
20 rows and 160 columns, and
instead of the classe variable there is an problem_id column to be
used as an identifier for the prediction results. The latter set,
was to be used for a different part of the assignment dealing
with specific class prediction.
Table 1: First 7 columns of the training dataset
| Variable | Type |
|---|---|
| X | integer |
| user_name | character |
| raw_timestamp_part_1 | integer |
| raw_timestamp_part_2 | integer |
| cvtd_timestamp | character |
| new_window | character |
| num_window | integer |
The first seven columns of the training dataset (X, user_name, raw_timestamp_part_1, raw_timestamp_part_2, cvtd_timestamp, new_window, num_window) are not related to the sensor measurements, but rather to the identity of the person, and the time stamps and capture windows for the sensor data (see Table 1). Because I am trying to produce a predictive model that only relies on the quantitative sensor measurements, I decided to remove these columns. In a similar fashion, the first seven columns of the testing dataset were also removed. This operation left me with a total of 153 columns in each data frames.
Thus, the data frame has, for each of the four sensors (positioned at the arm, forearm, belt, and dumbbell respectively), 38 different measurements (see Table 2 in Appendix 1). The problem then is to select from these 152 variables the ones relevant to predict a good exercise execution.
The automatic column type assignment of the read.csv() R function was not
always correct, in particular because several of the numeric columns contained
text data coming from sensor reading errors (e.g. “#DIV/0!”). So, I forced all
of the sensor readings to be numeric, and set the classe column as a
factor.
As a result of the type assignment some columns contained only NA values,
so these were removed from the dataset. Also, by using the
nearZeroVar() function of the caret package, I eliminated columns that
were considered uninformative (zero or near zero variance predictors).
Table 3: Number of columns by percentage of missing values
| Percentage of missing values | Number of columns |
|---|---|
| 0 | 53 |
| 98 | 65 |
After that last operation, the training data frame had only 118 variables including the classification column. Of these variables, I checked to see how many of them contained too many missing data values. Initially I set the threshold to 80%, but soon found out that there were two cases: columns without any missing data, and columns that had about 98% missing data (see Table 3). Trying to impute values in the latter cases could be done, but is unlikely that it will give anything reasonable or useful as a predictor, thus, those 65 columns were also removed.
In the end we will use 52 measurements of the x, y, and z axis components of the acceleration, gyroscope, and magnetometer sensors, as well as the overall acceleration, pitch, roll and yaw (see Table 4 in Appendix 2), to predict whether the exercise was done correctly.
Generating and validating a Random Forest predictive model
Because the provided testing dataset could not be used to validate the predictive model, I decided to split the “training” dataset into one to be used to perform the random forest model training (75% of the data), and another to validate it (25% of the data). The training will also assess the quality of the model using an “out of bag” (OOB) error estimate using cross-validation.
The model training used the standard random forest
(rf) algorithm4 method available in the caret package, with
the default parameters and doing a 10-fold cross validation. I used the
classe variable as the dependent and 52
sensor variables as predictors.
This model gave an OOB error of 0.6%, which indicates a possible good
classifier.
With the reserved validation set, I calculated
the confusion matrix (Table 5),
and other relevant statistics using the confusionMatrix()
function of the caret package. The confusion matrix shows that the
model does a reasonable good job at predicting the exercise quality.
Table 5: Confusion Matrix (Predicted vs Reference) for Random Forest model
| A | B | C | D | E | |
|---|---|---|---|---|---|
| A | 1395 | 12 | 0 | 0 | 0 |
| B | 0 | 935 | 5 | 0 | 0 |
| C | 0 | 2 | 847 | 3 | 2 |
| D | 0 | 0 | 3 | 800 | 0 |
| E | 0 | 0 | 0 | 1 | 899 |
Validating the model results in an accuracy of 0.9943 (95% confidence interval: [0.9918, 0.9962]). The estimated accuracy is well above the “no information rate” statistic of 0.2845. The validation results also in a high kappa statistic of 0.9928, which suggest a very good classifier. Overall, this model compares well with the 0.9803 accuracy that was reported in the original work.
The first 20 model predictors can be seen in Figure 2, and the complete list of predictors (ordered by their mean decrease in accuracy) is in Table 6 (Appendix 3)
Figure 2: Variable Importance for Random Forest model (first 20 variables)
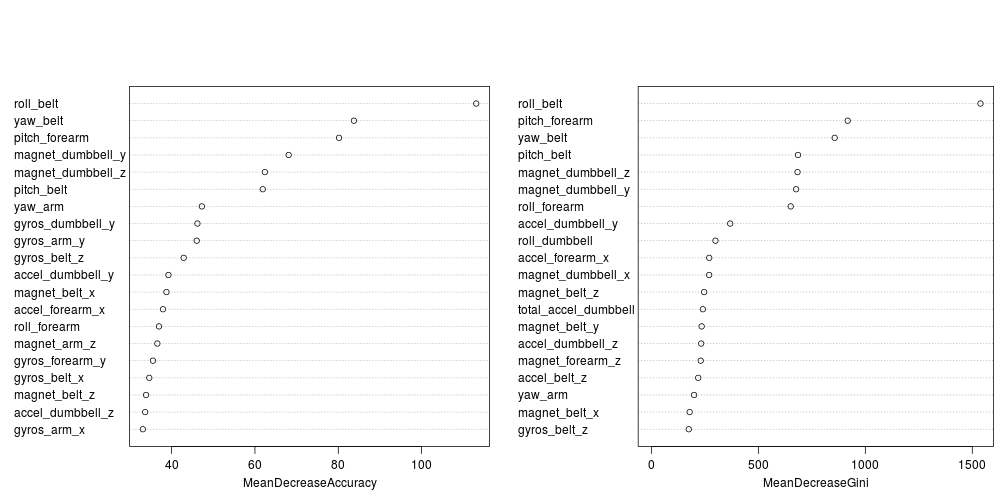
This plot indicates that the measurements of the belt sensor (roll, yaw, and pitch), the forearm (pitch) and the dumbbell (magnetic component), are the most important for distinguishing whether this particular exercise is being done correctly or not. This makes sense as the way the core body moves and the rotation of the forearm, are closely related to a correct execution of the biceps curl, and in the case of the metallic dumbbell the position changes are readily detected by the magnetometer.
Reproducibility information
The source code for the R Markdown document and other accessory artifacts is available at the github repository: https://github.com/jmcastagnetto/practical_machine_learning-coursera-june2015, and the assignment was originally published at https://jmcastagnetto.github.io/practical_machine_learning-coursera-june2015/ using a layout inspired but Tufte’s handout recommendations.
## R version 3.2.0 (2015-04-16)
## Platform: x86_64-pc-linux-gnu (64-bit)
## Running under: Ubuntu 14.04.2 LTS
##
## locale:
##  [1] LC_CTYPE=en_US.UTF-8       LC_NUMERIC=C
##  [3] LC_TIME=en_US.UTF-8        LC_COLLATE=en_US.UTF-8
##  [5] LC_MONETARY=en_US.UTF-8    LC_MESSAGES=en_US.UTF-8
##  [7] LC_PAPER=en_US.UTF-8       LC_NAME=C
##  [9] LC_ADDRESS=C               LC_TELEPHONE=C
## [11] LC_MEASUREMENT=en_US.UTF-8 LC_IDENTIFICATION=C
##
## attached base packages:
## [1] parallel  stats     graphics  grDevices utils     datasets  methods
## [8] base
##
## other attached packages:
##  [1] randomForest_4.6-7 doMC_1.3.3         iterators_1.0.7    foreach_1.4.2
##  [5] captioner_2.2.2    knitr_1.8          caret_6.0-47       ggplot2_1.0.0
##  [9] lattice_0.20-29    sjPlot_1.8.1
##
## loaded via a namespace (and not attached):
##  [1] Rcpp_0.11.5         formatR_1.0         plyr_1.8.1
##  [4] class_7.3-10        tools_3.2.0         digest_0.6.4
##  [7] lme4_1.1-6          evaluate_0.5.5      gtable_0.1.2
## [10] nlme_3.1-120        mgcv_1.8-6          psych_1.4.5
## [13] Matrix_1.1-4        DBI_0.3.1           yaml_2.1.13
## [16] brglm_0.5-9         SparseM_1.6         proto_0.3-10
## [19] e1071_1.6-4         BradleyTerry2_1.0-5 dplyr_0.4.1
## [22] stringr_0.6.2       gtools_3.4.1        sjmisc_1.0.2
## [25] grid_3.2.0          nnet_7.3-9          rmarkdown_0.6.1
## [28] minqa_1.2.3         reshape2_1.4        tidyr_0.2.0
## [31] car_2.0-25          magrittr_1.0.1      codetools_0.2-11
## [34] scales_0.2.4        htmltools_0.2.6     MASS_7.3-33
## [37] splines_3.2.0       assertthat_0.1      tufterhandout_1.2.1
## [40] pbkrtest_0.3-8      colorspace_1.2-6    quantreg_5.05
## [43] munsell_0.4.2       RcppEigen_0.3.2.1.2
Appendices
Appendix 1: Columns related to the sensors in the original training dataset
Table 2: Measurement columns by sensor
| arm | forearm | belt | dumbbell |
|---|---|---|---|
| accel_arm_x | accel_forearm_x | accel_belt_x | accel_dumbbell_x |
| accel_arm_y | accel_forearm_y | accel_belt_y | accel_dumbbell_y |
| accel_arm_z | accel_forearm_z | accel_belt_z | accel_dumbbell_z |
| amplitude_pitch_arm | amplitude_pitch_forearm | amplitude_pitch_belt | amplitude_pitch_dumbbell |
| amplitude_roll_arm | amplitude_roll_forearm | amplitude_roll_belt | amplitude_roll_dumbbell |
| amplitude_yaw_arm | amplitude_yaw_forearm | amplitude_yaw_belt | amplitude_yaw_dumbbell |
| avg_pitch_arm | avg_pitch_forearm | avg_pitch_belt | avg_pitch_dumbbell |
| avg_roll_arm | avg_roll_forearm | avg_roll_belt | avg_roll_dumbbell |
| avg_yaw_arm | avg_yaw_forearm | avg_yaw_belt | avg_yaw_dumbbell |
| gyros_arm_x | gyros_forearm_x | gyros_belt_x | gyros_dumbbell_x |
| gyros_arm_y | gyros_forearm_y | gyros_belt_y | gyros_dumbbell_y |
| gyros_arm_z | gyros_forearm_z | gyros_belt_z | gyros_dumbbell_z |
| kurtosis_picth_arm | kurtosis_picth_forearm | kurtosis_picth_belt | kurtosis_picth_dumbbell |
| kurtosis_roll_arm | kurtosis_roll_forearm | kurtosis_roll_belt | kurtosis_roll_dumbbell |
| kurtosis_yaw_arm | kurtosis_yaw_forearm | kurtosis_yaw_belt | kurtosis_yaw_dumbbell |
| magnet_arm_x | magnet_forearm_x | magnet_belt_x | magnet_dumbbell_x |
| magnet_arm_y | magnet_forearm_y | magnet_belt_y | magnet_dumbbell_y |
| magnet_arm_z | magnet_forearm_z | magnet_belt_z | magnet_dumbbell_z |
| max_picth_arm | max_picth_forearm | max_picth_belt | max_picth_dumbbell |
| max_roll_arm | max_roll_forearm | max_roll_belt | max_roll_dumbbell |
| max_yaw_arm | max_yaw_forearm | max_yaw_belt | max_yaw_dumbbell |
| min_pitch_arm | min_pitch_forearm | min_pitch_belt | min_pitch_dumbbell |
| min_roll_arm | min_roll_forearm | min_roll_belt | min_roll_dumbbell |
| min_yaw_arm | min_yaw_forearm | min_yaw_belt | min_yaw_dumbbell |
| pitch_arm | pitch_forearm | pitch_belt | pitch_dumbbell |
| roll_arm | roll_forearm | roll_belt | roll_dumbbell |
| skewness_pitch_arm | skewness_pitch_forearm | skewness_roll_belt | skewness_pitch_dumbbell |
| skewness_roll_arm | skewness_roll_forearm | skewness_roll_belt.1 | skewness_roll_dumbbell |
| skewness_yaw_arm | skewness_yaw_forearm | skewness_yaw_belt | skewness_yaw_dumbbell |
| stddev_pitch_arm | stddev_pitch_forearm | stddev_pitch_belt | stddev_pitch_dumbbell |
| stddev_roll_arm | stddev_roll_forearm | stddev_roll_belt | stddev_roll_dumbbell |
| stddev_yaw_arm | stddev_yaw_forearm | stddev_yaw_belt | stddev_yaw_dumbbell |
| total_accel_arm | total_accel_forearm | total_accel_belt | total_accel_dumbbell |
| var_accel_arm | var_accel_forearm | var_pitch_belt | var_accel_dumbbell |
| var_pitch_arm | var_pitch_forearm | var_roll_belt | var_pitch_dumbbell |
| var_roll_arm | var_roll_forearm | var_total_accel_belt | var_roll_dumbbell |
| var_yaw_arm | var_yaw_forearm | var_yaw_belt | var_yaw_dumbbell |
| yaw_arm | yaw_forearm | yaw_belt | yaw_dumbbell |
Appendix 2: Remaining columns related to the sensors
Table 4: Remaining measurement columns by sensor
| arm | forearm | belt | dumbbell |
|---|---|---|---|
| accel_arm_x | accel_forearm_x | accel_belt_x | accel_dumbbell_x |
| accel_arm_y | accel_forearm_y | accel_belt_y | accel_dumbbell_y |
| accel_arm_z | accel_forearm_z | accel_belt_z | accel_dumbbell_z |
| gyros_arm_x | gyros_forearm_x | gyros_belt_x | gyros_dumbbell_x |
| gyros_arm_y | gyros_forearm_y | gyros_belt_y | gyros_dumbbell_y |
| gyros_arm_z | gyros_forearm_z | gyros_belt_z | gyros_dumbbell_z |
| magnet_arm_x | magnet_forearm_x | magnet_belt_x | magnet_dumbbell_x |
| magnet_arm_y | magnet_forearm_y | magnet_belt_y | magnet_dumbbell_y |
| magnet_arm_z | magnet_forearm_z | magnet_belt_z | magnet_dumbbell_z |
| pitch_arm | pitch_forearm | pitch_belt | pitch_dumbbell |
| roll_arm | roll_forearm | roll_belt | roll_dumbbell |
| total_accel_arm | total_accel_forearm | total_accel_belt | total_accel_dumbbell |
| yaw_arm | yaw_forearm | yaw_belt | yaw_dumbbell |
Appendix 3: Random Forest Model - Variable Importance
Table 6: Variable importance per class and overall
| Variable | A | B | C | D | E | MeanDecreaseAccuracy | MeanDecreaseGini |
|---|---|---|---|---|---|---|---|
| roll_belt | 0.1 | 0.14 | 0.18 | 0.17 | 0.3 | 0.17 | 1538.04 |
| magnet_dumbbell_y | 0.13 | 0.18 | 0.24 | 0.25 | 0.08 | 0.17 | 676.76 |
| roll_forearm | 0.18 | 0.14 | 0.25 | 0.18 | 0.09 | 0.17 | 651.19 |
| magnet_dumbbell_z | 0.17 | 0.13 | 0.2 | 0.15 | 0.08 | 0.15 | 683.12 |
| yaw_belt | 0.13 | 0.12 | 0.16 | 0.21 | 0.07 | 0.14 | 856.82 |
| pitch_forearm | 0.13 | 0.07 | 0.12 | 0.14 | 0.07 | 0.11 | 917.67 |
| pitch_belt | 0.07 | 0.16 | 0.14 | 0.15 | 0.04 | 0.11 | 685.43 |
| accel_dumbbell_y | 0.05 | 0.05 | 0.13 | 0.06 | 0.04 | 0.06 | 368.41 |
| magnet_dumbbell_x | 0.06 | 0.06 | 0.09 | 0.08 | 0.03 | 0.06 | 270.17 |
| roll_dumbbell | 0.03 | 0.07 | 0.08 | 0.07 | 0.04 | 0.06 | 299.67 |
| accel_forearm_x | 0.03 | 0.05 | 0.05 | 0.09 | 0.04 | 0.05 | 270.45 |
| magnet_belt_z | 0.03 | 0.07 | 0.06 | 0.06 | 0.04 | 0.05 | 246.52 |
| accel_dumbbell_z | 0.03 | 0.05 | 0.06 | 0.06 | 0.05 | 0.05 | 232.89 |
| magnet_belt_y | 0.02 | 0.07 | 0.04 | 0.05 | 0.04 | 0.04 | 235.13 |
| magnet_forearm_z | 0.04 | 0.03 | 0.05 | 0.04 | 0.02 | 0.04 | 230.82 |
| total_accel_dumbbell | 0.02 | 0.03 | 0.02 | 0.07 | 0.03 | 0.03 | 240.75 |
| accel_belt_z | 0.02 | 0.03 | 0.04 | 0.03 | 0.02 | 0.03 | 218.91 |
| gyros_belt_z | 0.02 | 0.04 | 0.05 | 0.02 | 0.02 | 0.03 | 174.78 |
| yaw_dumbbell | 0.02 | 0.04 | 0.04 | 0.03 | 0.02 | 0.03 | 142.08 |
| accel_dumbbell_x | 0.02 | 0.03 | 0.04 | 0.03 | 0.01 | 0.03 | 109.73 |
| magnet_belt_x | 0.01 | 0.03 | 0.06 | 0.02 | 0.01 | 0.02 | 179.06 |
| roll_arm | 0.01 | 0.03 | 0.03 | 0.04 | 0.01 | 0.02 | 130.59 |
| accel_forearm_z | 0.01 | 0.02 | 0.04 | 0.03 | 0.02 | 0.02 | 134.18 |
| gyros_dumbbell_y | 0.03 | 0.02 | 0.04 | 0.02 | 0.01 | 0.02 | 128.5 |
| magnet_arm_x | 0.02 | 0.02 | 0.02 | 0.03 | 0.01 | 0.02 | 105.06 |
| yaw_arm | 0.03 | 0.01 | 0.03 | 0.02 | 0.01 | 0.02 | 199.59 |
| yaw_forearm | 0.01 | 0.01 | 0.02 | 0.05 | 0.01 | 0.02 | 107.99 |
| magnet_forearm_y | 0.02 | 0.01 | 0.02 | 0.02 | 0.01 | 0.02 | 119.26 |
| magnet_arm_y | 0.01 | 0.02 | 0.02 | 0.03 | 0.01 | 0.02 | 110.55 |
| accel_arm_x | 0.01 | 0.02 | 0.02 | 0.03 | 0.01 | 0.02 | 110.08 |
| gyros_belt_x | 0.03 | 0 | 0.02 | 0.01 | 0 | 0.01 | 44.61 |
| pitch_dumbbell | 0.01 | 0.03 | 0.02 | 0.01 | 0.01 | 0.01 | 85.39 |
| magnet_forearm_x | 0.01 | 0.01 | 0.01 | 0.02 | 0.01 | 0.01 | 118.85 |
| pitch_arm | 0.01 | 0.01 | 0.01 | 0.01 | 0.01 | 0.01 | 87.83 |
| accel_belt_y | 0.01 | 0.01 | 0.02 | 0.02 | 0 | 0.01 | 39.47 |
| magnet_arm_z | 0.01 | 0.01 | 0.02 | 0.01 | 0 | 0.01 | 89.67 |
| accel_forearm_y | 0.01 | 0.01 | 0.02 | 0.01 | 0.01 | 0.01 | 63.7 |
| gyros_belt_y | 0 | 0.01 | 0.03 | 0.01 | 0 | 0.01 | 44.02 |
| gyros_arm_y | 0.01 | 0.01 | 0.01 | 0.01 | 0 | 0.01 | 81.3 |
| accel_arm_y | 0.01 | 0.01 | 0.01 | 0.01 | 0 | 0.01 | 67.4 |
| accel_belt_x | 0.01 | 0.01 | 0.01 | 0.01 | 0 | 0.01 | 36.11 |
| gyros_arm_x | 0.01 | 0.01 | 0.01 | 0.01 | 0 | 0.01 | 60.55 |
| gyros_dumbbell_x | 0 | 0.01 | 0.02 | 0.01 | 0 | 0.01 | 62.73 |
| total_accel_belt | 0.01 | 0.01 | 0.01 | 0.01 | 0.01 | 0.01 | 49.92 |
| accel_arm_z | 0.01 | 0.01 | 0.01 | 0.01 | 0 | 0.01 | 53.74 |
| gyros_forearm_y | 0 | 0.01 | 0.01 | 0.01 | 0 | 0.01 | 58.59 |
| total_accel_forearm | 0.01 | 0 | 0.01 | 0 | 0 | 0.01 | 40.89 |
| total_accel_arm | 0 | 0.01 | 0.01 | 0.01 | 0 | 0 | 47.5 |
| gyros_dumbbell_z | 0 | 0 | 0 | 0 | 0 | 0 | 40.05 |
| gyros_forearm_z | 0 | 0.01 | 0 | 0 | 0 | 0 | 39.34 |
| gyros_forearm_x | 0 | 0 | 0.01 | 0.01 | 0 | 0 | 26.71 |
| gyros_arm_z | 0 | 0 | 0 | 0 | 0 | 0 | 23.53 |
- For more details see “The Weight Lifting Exercises Dataset“ [return]
- Velloso, E.; Bulling, A.; Gellersen, H.; Ugulino, W.; Fuks, H. Qualitative Activity Recognition of Weight Lifting Exercises. Proceedings of 4th International Conference in Cooperation with SIGCHI (Augmented Human ‘13) . Stuttgart, Germany: ACM SIGCHI, 2013. [return]
- Image obtained from http://groupware.les.inf.puc-rio.br/har#weight_lifting_exercises [return]
- randomForest: Breiman and Cutler’s random forests for classification and regression [return]