Background
Sitepoint has published the results of their 2015 PHP Framework popularity survey1. In that post they show that the survey gives a very large edge to Laravel. The people at Sitepoint were also nice enough to publish their properly anonymized dataset in a github repo2
So I went ahead, and forked their repo and fired up R to give this data a go.
Exploring the dataset
I read the survey into a data frame, and looked at the overall structure:
library("dplyr")
library("reshape2")
library("ggplot2")
library("knitr")
library("ROCR")
library("rpart")
library("rpart.plot")
survey <- tbl_df(read.csv("../dump/survey.csv", stringsAsFactors = FALSE))
glimpse(survey)
## Variables:
## $ id                           (int) 76, 70, 71, 72, 68, 69, 66, 87, 9...
## $ start.date                   (chr) "2015-02-27 17:16:59", "2015-02-2...
## $ submit.date                  (chr) "2015-02-27 17:19:23", "2015-02-2...
## $ network                      (chr) "7387618cfa96eeb8ac02785f782af164...
## $ age.group                    (int) 4, 3, 4, 4, 3, 3, 3, 2, 3, 3, 2, ...
## $ country                      (chr) "Slovenia", "France", "United Sta...
## $ years.php                    (int) 10, 7, 15, 10, 8, 10, 6, 3, 14, 5...
## $ years.programming            (int) 19, 13, 15, 20, 11, 15, 15, 5, 16...
## $ education                    (int) 1, 5, 6, 1, 5, 2, 3, 5, 5, 5, 5, ...
## $ numframeworks                (int) 2, 3, 2, 4, 4, 3, 1, 3, 2, 1, 2, ...
## $ fw.work.choice               (chr) "CodeIgniter", "Symfony2", "Compa...
## $ fw.work.other                (chr) "", "", "", "", "", "", "", "", "...
## $ fw.work.reason.easy          (chr) "1", "", "", "1", "1", "1", "1", ...
## $ fw.work.reason.community     (int) 1, NA, NA, NA, NA, 1, NA, NA, 1, ...
## $ fw.work.reason.tutorials     (int) 1, NA, NA, NA, NA, 1, NA, NA, NA,...
## $ fw.work.reason.tested        (int) 1, 1, NA, NA, NA, NA, NA, NA, 1, ...
## $ fw.work.reason.features      (int) 1, NA, NA, 1, 1, NA, NA, NA, NA, ...
## $ fw.work.reason.forced        (int) NA, NA, NA, 1, NA, NA, NA, 1, NA,...
## $ fw.work.reason.other         (int) NA, NA, 1, NA, 1, NA, NA, NA, 1, ...
## $ fw.work.reason.other.why     (chr) "", "", "We use Kohana", "", "", ...
## $ fw.personal.choice           (chr) "CodeIgniter", "Symfony2", "Larav...
## $ fw.personal.other            (chr) "", "", "", "", "", "", "", "", "...
## $ fw.personal.reason.easy      (chr) "1", "", "1", "1", "1", "1", "", ...
## $ fw.personal.reason.community (int) 1, NA, 1, 1, NA, 1, 1, NA, 1, NA,...
## $ fw.personal.reason.tutorials (int) 1, 1, 1, 1, NA, 1, 1, NA, NA, NA,...
## $ fw.personal.reason.tested    (int) 1, NA, NA, NA, NA, 1, NA, NA, 1, ...
## $ fw.personal.reason.features  (int) 1, NA, 1, 1, NA, 1, 1, NA, NA, NA...
## $ fw.personal.reason.other     (int) NA, NA, NA, NA, 1, NA, NA, NA, NA...
## $ fw.personal.reason.other.why (chr) "", "", "", "", "It provides the ...
## $ contributes                  (chr) "No", "No", "No", "No", "No", "No...
## $ laravel                      (int) NA, NA, NA, NA, NA, NA, NA, NA, N...
## $ yii1                         (int) NA, NA, NA, NA, NA, NA, NA, NA, N...
## $ yii2                         (int) NA, NA, NA, NA, NA, NA, NA, NA, N...
## $ zf1                          (int) NA, NA, NA, NA, NA, NA, NA, NA, N...
## $ zf2                          (int) NA, NA, NA, NA, NA, NA, NA, NA, N...
## $ symfony2                     (int) NA, NA, NA, NA, NA, NA, NA, NA, 1...
## $ phalcon                      (int) NA, NA, NA, NA, NA, NA, NA, NA, N...
## $ aura                         (int) NA, NA, NA, NA, NA, NA, NA, NA, N...
## $ slim                         (int) NA, NA, NA, NA, NA, NA, NA, NA, N...
## $ silex                        (int) NA, NA, NA, NA, NA, NA, NA, NA, N...
## $ webiny                       (int) NA, NA, NA, NA, NA, NA, NA, NA, N...
## $ cake                         (int) NA, NA, NA, NA, NA, NA, NA, NA, N...
## $ fuel                         (int) NA, NA, NA, NA, NA, NA, NA, NA, N...
## $ kohana                       (int) NA, NA, NA, NA, NA, NA, NA, NA, N...
## $ ci                           (int) NA, NA, NA, NA, NA, NA, NA, NA, N...
## $ prado                        (int) NA, NA, NA, NA, NA, NA, NA, NA, N...
## $ phpixie                      (int) NA, NA, NA, NA, NA, NA, NA, NA, N...
## $ flight                       (int) NA, NA, NA, NA, NA, NA, NA, NA, N...
## $ simple                       (int) NA, NA, NA, NA, NA, NA, NA, NA, N...
## $ typo                         (int) NA, NA, NA, NA, NA, NA, NA, NA, N...
## $ nette                        (int) NA, NA, NA, NA, NA, NA, NA, NA, N...
## $ agavi                        (int) NA, NA, NA, NA, NA, NA, NA, NA, N...
## $ other                        (chr) "", "", "", "", "", "", "", "", "...
It seems that the first 30 columns relate to personal
information and preferences for each respondent (identified by the
id field). The next 22 columns comprise a very sparse matrix that
encodes what frameworks (including a write-in option) the respondent
has made contributions.
So I decided to extract that section of the dataset and do some quick analysis looking at the frequencies of contributions, and how it related to the results of framework popularity.
The reason to do that, is to try and get a feeling on the extent to which each project (framework) has a community that not only benefits from it, but also works towards improving it by contributing to the code, documentation, etc.
Let’s look first at the contributions to the list of selected frameworks:
# the framework contribution "matrix"
contrib <- survey %>% select(id,laravel:agavi)
ncontrib <- as.data.frame(
  table(rowSums(contrib[, -1], na.rm=TRUE))) %>%
  mutate(pFreq=round(100*Freq/nrow(contrib), 2))
colnames(ncontrib) <- c("Number of frameworks",
                       "Count", "Percent of total")
kable(ncontrib, align=c("c", "c", "c"),
      caption="Distribution of number of frameworks contributed to by respondents")
Distribution of number of frameworks contributed to by respondents
| Number of frameworks | Count | Percent of total |
|---|---|---|
| 0 | 6327 | 81.80 |
| 1 | 1033 | 13.35 |
| 2 | 239 | 3.09 |
| 3 | 84 | 1.09 |
| 4 | 31 | 0.40 |
| 5 | 11 | 0.14 |
| 6 | 4 | 0.05 |
| 7 | 5 | 0.06 |
| 8 | 1 | 0.01 |
So, about 18.2% of survey respondents contribute to at least one framework (without including the “write-ins”)
Now, I will convert the data from a “wide” to a “long”
format, using the reshape2 package, and also mangle the
write-ins (other field) to be able to combine that
with the other data.
contrib.long <- melt(contrib, id.vars = "id",
                     variable.name = "framework",
                     value.name = "count",
                     na.rm = TRUE)
head(contrib.long)
##     id framework count
## 14 134   laravel     1
## 40 214   laravel     1
## 68 328   laravel     1
## 77 365   laravel     1
## 82 381   laravel     1
## 94 427   laravel     1
summary(contrib.long)
##        id           framework       count
##  Min.   :   99   laravel :355   Min.   :1
##  1st Qu.: 7594   symfony2:344   1st Qu.:1
##  Median :15986   yii2    :181   Median :1
##  Mean   :19142   zf2     :171   Mean   :1
##  3rd Qu.:29910   ci      :165   3rd Qu.:1
##  Max.   :47233   nette   :132   Max.   :1
##                  (Other) :661
It seems that the count field is not informative at all, so we can safely
remove it.
contrib.long <- contrib.long[,1:2]
While mangling the “write-ins”, I noticed a large amount of empty answers, which is reasonable if you consider that the options given in the survey contained the most popular frameworks.
# the write-ins
contrib.writeins <- survey[,c(1,53)]
nrow(contrib.writeins)
## [1] 7735
head(contrib.writeins)
## Source: local data frame [6 x 2]
##
##   id other
## 1 76
## 2 70
## 3 71
## 4 72
## 5 68
## 6 69
# let's remove the empty rows
contrib.writeins <- subset(contrib.writeins, other != "")
nrow(contrib.writeins)
## [1] 168
head(contrib.writeins)
## Source: local data frame [6 x 2]
##
##       id                other
## 135  556 Simple MVC Framework
## 215  884               drupal
## 226  925 Simple MVC Framework
## 276 1122 Simple MVC Framework
## 278 1131 Simple MVC Framework
## 287 1169                nette
In the end there are only 168 write-in answers out of 7735 responses, which corresponded to about 2.17% of the entries in the survey.
Finally, I combined the two data frames to get all possible frameworks to which people are contributing. I also had to remove the string “ framework” from the “write-ins” to help group them better, because there were entries such as “xyz” and “xyz framework” which made reference to the same thing.
colnames(contrib.writeins) <- c("id", "framework")
contrib.long <- rbind(contrib.long, contrib.writeins)
contrib.long$framework <- gsub(" framework","",
                               contrib.long$framework)
Computing the frequencies of contributions
I used dplyr to quickly summarize the results in the long data
frame, calculating the frequency count and percent for each
framework.
One thing I noticed is that there was a small number of entries such as: “i also contribute to php itself” or “took part in customer’s development, also fixed codeigniter long tim”, and most of these anomalous “frameworks” were single cases,
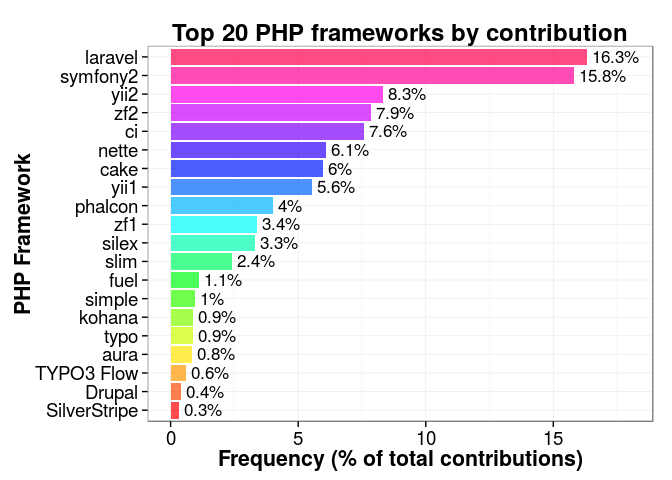
Using this summary, I made a bar chart of the top 20 frameworks
to which people contribute, with the package ggplot2.
contrib.summ <- contrib.long %>%
  group_by(framework) %>%
  summarise(freq=n(), pfreq=100*n()/nrow(contrib.long)) %>%
  arrange(desc(freq))
contrib.summ$framework <- factor(contrib.summ$framework,
                                levels=rev(contrib.summ$framework),
                                ordered=TRUE)
top20 <- contrib.summ[1:20,]

ggplot(top20, aes(x=framework, y=pfreq)) +
  geom_bar(stat="identity", fill=rainbow(20), alpha=0.7) +
  geom_text(label=paste0(" ",round(top20$pfreq,1), "%"), hjust=0, size=4.5) +
  xlab("PHP Framework") +
  ylab("Frequency (% of total contributions)") +
  ylim(c(0,18)) +
  ggtitle("Top 20 PHP frameworks by contribution") +
  coord_flip() +
  theme_bw() +
  theme(axis.text=element_text(size=14),
        axis.title=element_text(size=16, face="bold"),
        plot.title=element_text(size=18, face="bold"))
Comparisons with the votes for popular frameworks
Let’s now look at the correspondence between frameworks used for work and personal projects, and whether the respondent contributes to at least one framework.
personal <- survey[,c(1,5:11,21,30)]
survey$samefw <- survey$fw.work.choice == survey$fw.personal.choice
survey$contributes <- rowSums(contrib[, -1], na.rm=TRUE) > 0
(xt1 <- xtabs( ~ samefw + contributes, survey))
##        contributes
## samefw  FALSE TRUE
##   FALSE  2055  350
##   TRUE   4272 1058
Out of every ~7 people who use different frameworks for work and personal projects, 1 contributes to at least one of those frameworks. And, out of ~5 people who use the same framework at work and personal projects, 1 contributes to at least one framework.
xt2 <- round(100*xt1 / nrow(survey), 1)
If we look at this in overall percentages of respondents, we find that:
- 26.6% use different frameworks for work and personal projects, and do not contribute to any framework
- 4.5% use different frameworks but contribute to at least one framework
- 55.2% use the same framework for work and personal projects, but do not contribute to any framework
- 13.7% use the same framework and contribute to at least to one of them
Will there be a difference between contributions for the most popular framework (according to Sitepoint’s 2015 survey): Laravel? How about for the second most popular: Symfony2?
Again, we use dplyr to summarize this data. First for the use at work, filtering for the cases where the total number of entries of at least 20 for the framework, and for entries with an empty name:
contrib_fw_work <- survey %>%
  select(id, fw.work.choice, contributes) %>%
  group_by(fw.work.choice) %>%
  summarise(ncontrib=sum(contributes), ntotal=n()) %>%
  filter(ntotal >= 20 & fw.work.choice !="" ) %>%
  mutate(pcontrib=ncontrib/ntotal) %>%
  arrange(desc(pcontrib))
contrib_fw_work %>% filter(fw.work.choice %in% c("Laravel", "Symfony2"))
## Source: local data frame [2 x 4]
##
##   fw.work.choice ncontrib ntotal  pcontrib
## 1       Symfony2      245   1067 0.2296157
## 2        Laravel      273   1658 0.1646562
And next for the personal use:
contrib_fw_personal <- survey %>%
  select(id, fw.personal.choice, contributes) %>%
  group_by(fw.personal.choice) %>%
  summarise(ncontrib=sum(contributes), ntotal=n()) %>%
  filter(ntotal >= 20 & fw.personal.choice !="" ) %>%
  mutate(pcontrib=ncontrib/ntotal) %>%
  arrange(desc(pcontrib))
contrib_fw_personal %>% filter(fw.personal.choice %in% c("Laravel", "Symfony2"))
## Source: local data frame [2 x 4]
##
##   fw.personal.choice ncontrib ntotal  pcontrib
## 1           Symfony2      241   1005 0.2398010
## 2            Laravel      314   2110 0.1488152
So Laravel (the most popular framework) has a community engamement (contribution) of about 15-16%, and Symfony2 something between 23-24%.
If we look at the top 3 frameworks as measured by contributions, the situation is quite different than the popularity statistics:
kable(contrib_fw_work[1:3,], digits = 2,
      caption="Ranking of frameworks used at work by contribution")
Ranking of frameworks used at work by contribution
| fw.work.choice | ncontrib | ntotal | pcontrib |
|---|---|---|---|
| Typo 3 | 20 | 35 | 0.57 |
| CakePHP | 80 | 254 | 0.31 |
| Zend Framework 2 | 109 | 390 | 0.28 |
kable(contrib_fw_personal[1:3,], digits = 2,
      caption="Ranking of frameworks used for personal projects by contribution")
Ranking of frameworks used for personal projects by contribution
| fw.personal.choice | ncontrib | ntotal | pcontrib |
|---|---|---|---|
| Typo 3 | 12 | 20 | 0.60 |
| CakePHP | 73 | 229 | 0.32 |
| Zend Framework 2 | 107 | 346 | 0.31 |
It is interesting that these are frameworks that are mature and have been around for quite some time. They might not be the most popular frameworks in 2015, but they do have a very good percentage of people who use them also contributing improvements, documentation, etc.
Modeling contribution
The following is not a strict modeling analysis, at best it is a preliminary exploration trying to figure out if it is possible to understand contributions in terms of the variables acquired in the Sitepoint’s 2015 survey.
First, we need to calculate the base accuracy, i.e. assigning
to all rows the most frequent value for contribution (FALSE).
(base_acc <- sum(survey$contributes==FALSE) / nrow(survey))
## [1] 0.8179703
Then, we try a logistic regression (why not?), and let’s not worry about possible colinearity and other hairy issues.
survey$age.group <- factor(survey$age.group)
survey$education <- factor(survey$education)
logmodel <- glm(contributes ~ samefw + age.group + years.php +
                years.programming + education + numframeworks,
                data=survey, family="binomial")
summary(logmodel)
##
## Call:
## glm(formula = contributes ~ samefw + age.group + years.php +
##     years.programming + education + numframeworks, family = "binomial",
##     data = survey)
##
## Deviance Residuals:
##     Min       1Q   Median       3Q      Max
## -2.3538  -0.6675  -0.5746  -0.4538   2.6024
##
## Coefficients:
##                     Estimate Std. Error z value Pr(>|z|)
## (Intercept)       -2.4184238  0.2683388  -9.013  < 2e-16 ***
## samefwTRUE         0.3937101  0.0686493   5.735 9.75e-09 ***
## age.group2         0.2776321  0.2564490   1.083 0.278985
## age.group3        -0.1709346  0.2594904  -0.659 0.510068
## age.group4        -0.4791895  0.2786983  -1.719 0.085544 .
## age.group5        -1.2118313  0.3650170  -3.320 0.000900 ***
## years.php          0.0665785  0.0121997   5.457 4.83e-08 ***
## years.programming  0.0008912  0.0092778   0.096 0.923473
## education2        -0.0907414  0.1302166  -0.697 0.485897
## education3        -0.4092336  0.1394284  -2.935 0.003335 **
## education4        -0.2101331  0.1028052  -2.044 0.040954 *
## education5        -0.0983835  0.0884050  -1.113 0.265763
## education6         0.1336008  0.0992409   1.346 0.178229
## education7         0.8844739  0.2572563   3.438 0.000586 ***
## numframeworks      0.0982868  0.0155403   6.325 2.54e-10 ***
## ---
## Signif. codes:  0 '***' 0.001 '**' 0.01 '*' 0.05 '.' 0.1 ' ' 1
##
## (Dispersion parameter for binomial family taken to be 1)
##
##     Null deviance: 7339.9  on 7734  degrees of freedom
## Residual deviance: 7099.5  on 7720  degrees of freedom
## AIC: 7129.5
##
## Number of Fisher Scoring iterations: 4
logpred <- predict(logmodel, type="response")
(logct <- table(logpred >= 0.5, survey$contributes))
##
##         FALSE TRUE
##   FALSE  6317 1394
##   TRUE     10   14
(log_acc <- (logct[1,1] + logct[2,2]) / nrow(survey))
## [1] 0.8184874
The logistic model seem to indicate that the total number of years of programming experience is not as significative, as, for example, the number of year programming in PHP, at least to predict contributions to PHP frameworks.
As we can see there is a slight improvement in the accuracy using this naive model, going from 0.8179703 (the base value) to 0.8184874, a difference of just \( 5.1712993\times 10^{-4} \).
We can now plot and calculate the AUC that we can expect with this model.
rpred1 <- prediction(logpred, survey$contributes)
perf1 <- performance(rpred1, measure="tpr", x.measure="fpr")
plot(perf1, main="ROC curve for logistic model")
abline(a=0, b=1, lty="dashed", col="blue")
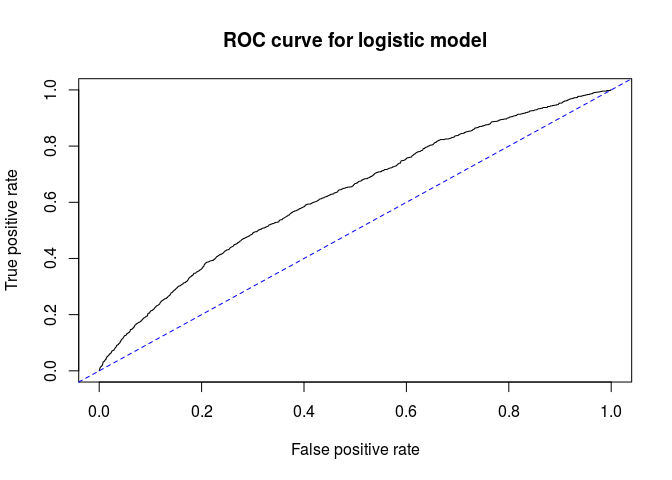
(auc1 <- as.numeric(performance(rpred1, "auc")@y.values))
## [1] 0.6288363
Better than the baseline of 0.5, but not that great. Also, this model gives us still a great number of false negatives: people predicted not to contribute, but that do otherwise.
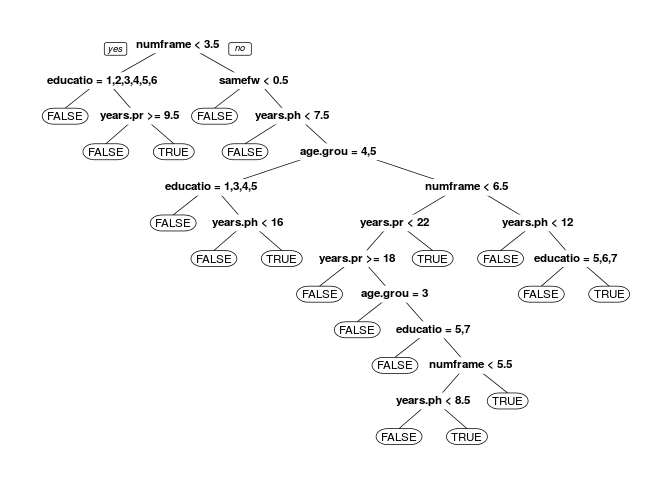
Finally we will try to use a classification tree, and see if that gives us a better model.
treemodel <- rpart(contributes ~ samefw + age.group + years.php +
               years.programming + education + numframeworks,
               data=survey,
               method = "class", cp=0.001)
prp(treemodel)
treepred <- predict(treemodel, type="class")
(treect <- table(treepred, survey$contributes))
##
## treepred FALSE TRUE
##    FALSE  6303 1352
##    TRUE     24   56
(tree_acc <- (treect[1,1] + treect[2,2]) / nrow(survey))
## [1] 0.8221073
The resulting tree is a bit complex and might be overfitted, and, as we can see, affords a very slight improvement in the accuracy, going from 0.8179703 (the base value) to 0.8184874, a difference of just \( 5.1712993\times 10^{-4} \). The extremely small improvement does not warrant the complexity of the decision tree model.
Bottomline: I am not convinced that we can model contribution using the variables collected in this survey. Of course, that was not the goal of the survey, so it there is no surprise there.
Acknowledgments
Thanks to Bruno Skvorc (@bitfalls) for the helpful clarifications on the structure of the dataset.